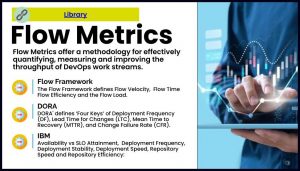
 Flow Metrics offer a methodology for effectively quantifying, measuring and improving the throughput of DevOps work streams.
Monitor key performance indicators (KPIs) to track progress and identify bottlenecks in the development process.
Establishing the right ones will enable development teams to define and measure what matters, providing a control loop for ensuring their transformation and new working processes deliver the results they want. Use metrics like cycle time, lead time, and throughput to measure team performance and make data-driven decisions for improvement.
 Project to Product
An industry thought leader on this topic is Mik Kersten. He has documented his insights into a book Project to Product, and in this talk he summarizes it by showing how a product operating model can provide the critical glue between the hierarchical and finance-oriented structures of the business and the agility enabled by delivery teams adopting SAFe.
As the title suggests this is centred around a shift from a waterfall, project budgeting approach to one of ‘Lean Budgets‘.
Lean and value stream thinking originated in manufacturing but have become highly popularized in software delivery by the DevOps movement: With developers releasing code changes more frequently thanks to Agile, DevOps set its sights on getting those code changes running in production faster.
Flow Metrics: Flow time, Flow Velocity, Flow Efficiency
In this webinar Dominica DeGrandis explains Flow Metrics in detail and how to implement these key metrics at an organization and how to enhance the impact of software products.
From 2.08 she sets the scene defining that that flow metrics are tied to business value and are based on outcomes. Flow metrics provide a feedback loop to improve decisions.
Flow Time
At 4:36 Dominica explains the metric, ‘Flow Time’. Flow Time is the duration from when work enters the value stream to its completion. This metric is helpful in answering questions like ‘What’s the probability of completing work in X days?
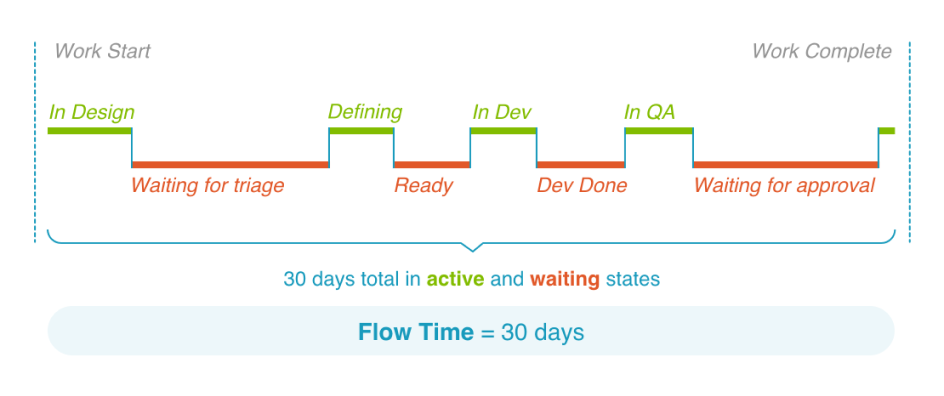
This metric helps in identifying when the time to value is getting longer, and is the measure of time taken for the items to process from ‘start’ to ‘complete’ state. This would include both active and wait times.
Flow Velocity
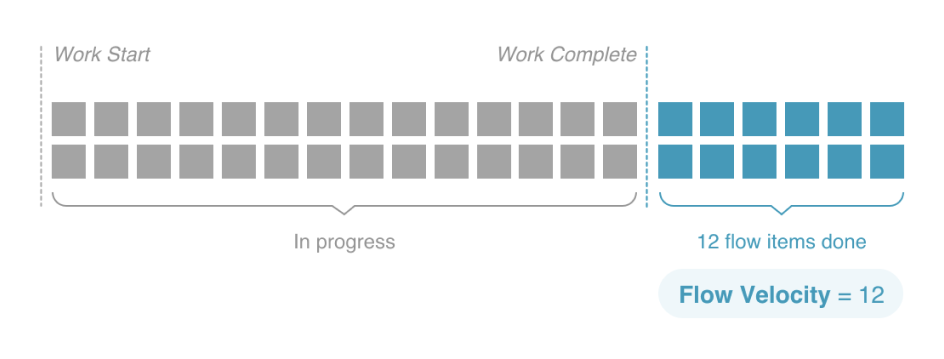
At 16:32 she moves on to discussing the next important metric, which is the ‘Flow Velocity’.
Flow Velocity can be defined as the number of items completed during a given duration of time. This metric is easy to calculate and provides data to the software development teams to view the delivery rates, gauging if the value delivery is progressing in an accelerated manner. This metric is commonly referred to as throughput.
At 19:12 Dominica states that there are two important factors that need to be considered while choosing the batch size. Batch size is often decided based on the transaction cost and holding cost. Reducing the batch size of work helps in reducing the WIP (Work in progress) limit and improves the flow.
The optimal batch size primarily depends on holding cost including the cost for delayed feedback, inventory decay, and delayed value delivery). Software development teams must always focus on reducing the transaction costs of any batch.
Flow Efficiency
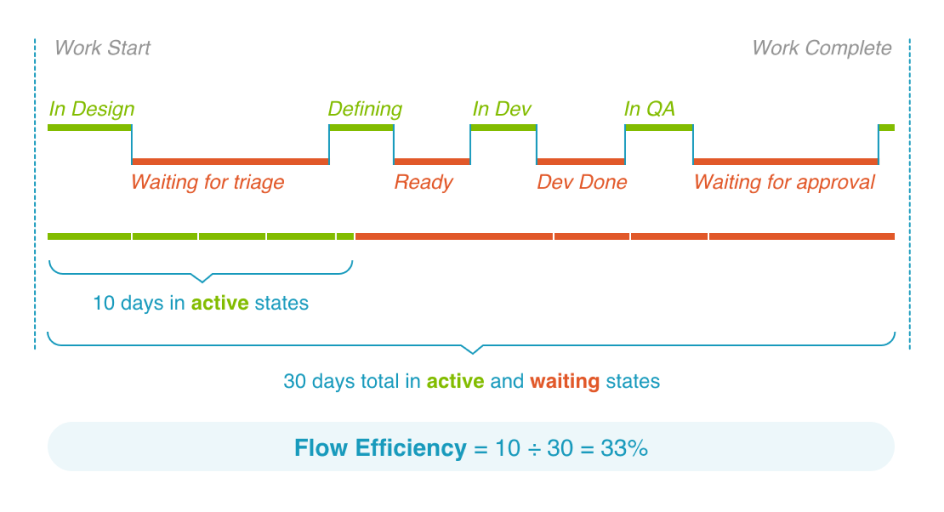
At 20:51 Dominica explains the ‘Flow Efficiency’ metric, the percentage of time where work is in an active state and is a metric to expose wait time. Flow efficiency metrics can easily help in identifying when waste is decreasing or increasing in a process. In other work, these metrics can be defined as the ratio of active time vs wait time of the overall flow time.
Flow Load
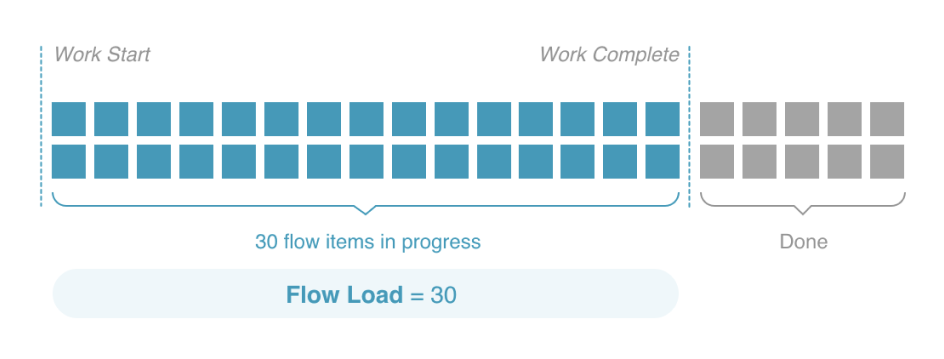
At 30:22 she defines the metric ‘Flow Load’, a metric to measure the balance between demand and capacity. Flow Load is responsible for monitoring the over-utilized and under-utilized value streams, where often the over-utilization and the under-utilization of value streams can lead to reduced productivity. This metric measures the number of Flow Items that are currently in the active or waiting state within a specific value stream.
At 31:32 she emphasizes that WIP (Work in progress) is a leading indicator, for example a high WIP means that the other items are waiting in the queue for a longer time. The important factor which affects queue size is capacity utilization, the metric to calculate the rate at which the outputs are being achieved.
Queueing Theory
From 33:00 Dominica discusses the ‘Queueing Theory’, which enables quantifying the relationship between wait times and capacity utilization. As the capacity utilization approaches 100%, wait time increases exponentially.
Software development teams need to consider managing work by queues if the desired goal is speed. At 35:47, she mentions that the amount of WIP (Work in progress) is the primary factor of speed. If there is a requirement to achieve maximum business value, the proportion of work items in a value stream needs to be adjusted. Often a decision to do one thing is a decision to delay something else.
At 43:20 she illustrates a sample value stream dashboard displaying all the flow metrics. The dashboard would comprise prominent flow metrics like Flow Efficiency, Flow Time, Flow Load, Flow Velocity, and Flow Distribution. The dashboards can also have the business value, business cost, business happiness, and business quality index.
At 46:35 Dominica talks about the metric to gauge happiness, a metric that answers questions like ‘How likely are you to recommend working for this company to a friend?
If you are interested in visualizing and optimizing the business value of your software delivery, measuring business outcomes is a must, and Flow Metrics provide a framework for achieving this.