Unleash the Power of DevOps with Value Stream Management
A value stream map is a visual tool that displays all critical steps in a specific process and easily quantifies the time and volume taken at each stage.
 The key activity for realizing improvements in DevOps performance is Value Stream Management.
Mapping DevOps value streams enables the team to understand how work flows through the different functions, right from idea inception through to deployment, and where constrictions occur that slow the overall system throughput, identifying key constraints like slow hand-off interactions.
Writing for the New Stack, Jeff Keyes of Plutora, defines that Value Streams are the Future of DevOps, highlighting that often DevOps mistakenly focuses purely on tools and automation, and that VSM is key to unlocking high performance.
As Dominica DeGrandis explains in this blog the disconnects between systems and departments are typically the main focal point of errors and lost time and delays. The hand-offs generate a considerable wastage of time and effort, slowing the DevOps Flow.
The Carnegie Mellon Software Engineering Institute describes that VSM is a Lean technique for visualizing, characterizing, and continuously improving the flow of value across this set of end-to-end activities by eliminating barriers, whether procedural, cultural, technological, or organizational.
Implementing Value Streams
On the VMware blog Mandy Storbakken provides an example of value stream mapping IT workflows and how this can illustrate the means for defining DevOps Flow metics, via a server provisioning process:
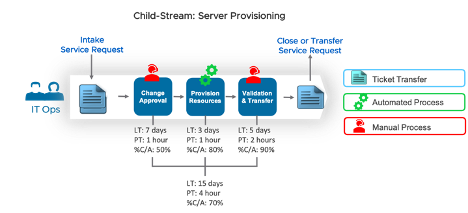
50% Complete & Accurate – Half the time, this stage cannot be completed without gathering more information or correcting something; 1-hour Processing Time – This stage could be completed in one hour, if there were no delays; 7 days Lead Time – This stage typically takes seven days to complete, which could be time in the queue, time awaiting additional information, or time waiting for the change review board.
She adds:
“The metrics across all stages, from ops intake to ops hand-off, show that while it typically takes around 15 days to complete the stages, the actual processing of work only accounts for four hours over that time (15 days LT, four hours PT). An Activity Ratio (AR) – which is the total process time divided by the total lead time, times 100 – can also be derived from these metrics.”
From this she concludes by articulating how VSM typically uses four core metrics to analyze the flow of work through each stage in a value stream, and that these metrics should be derived from actual timings for each stage (not based on SLAs):
[box type=”info” align=”” class=”” width=””]
- Lead Time (LT) – Time to complete the stage, from intake to hand-off.
- Process Time (PT) – Time it could take to complete the stage, if all information were complete and the process were uninterrupted.
- Complete & Accurate (%C/A) – How often the stage can be completed without needing additional information or corrections.
- Value Added (VA) – A ‘yes’ or ‘no’ indication of whether the stage adds direct customer value.
[/box]
Speaking at the DevOps Conference, Stephen Walters of GitLab defines the measures that should be inspected to identify the typical measures for the flow of value. Stephen is a co-author of the DevOps Institute Value Stream Reference Architecture Paper, a best practice framework to correctly identify value streams within an enterprise, and to implement organization around those value streams.