Atlassian – Modular Platform for Building an Integrated DevOps Toolchain
Atlassian offers an open ecosystem approach where a multitude of different vendors can be plug and play integrated together to achieve a single DevOps Value Stream.
 Atlassian is a stalwart of the DevOps industry, used by over 200,000 organizations worldwide.
They offer a suite of tools for automating the DevOps life-cycle, spanning from planning and collaboration through shipping code and service tracking, augmented by a third-party partner marketplace.
Integrated Toolchain
In the feature video the Head of DevOps Product Suzie Prince walks through what’s new with the suite.
From 4:00m Suzie focuses on the core message, the goal central to DevOps Flow, building an Integrated Toolchain. In other words it’s essential that each DevOps app doesn’t form yet another isolated silo, existing on their own as a standalone tool, but rather functions as a component part of an overall high performance value stream.
As Eric Billingsley writes on DevOps.com, the challenges developers face include poor interoperability between tools and manual handoffs causing DevOps automation silos, multiple test environments used through the process and the need for multi-cloud and hybrid deployments adding tons of unnecessary complexity, and increased policy and security requirements that simply cannot scale and remain manual.
Suzie states no one vendor can address this complexity and so a modular plug and play approach that integrates multiple vendors into a single value stream is the ideal solution. She describes how Jira can act as this integrating backbone with different vendors being plugged in to enable certain modular functionality, such that an idea, a commit, a branch or a bug-fix is linked to a Jira ticket, and end-to-end workflow is automated and visibility is laddered up to management in a consistent form.
A deep plethora of partners can be plugged in this way, to assemble the permutation of tool combinations best suited to your organizations needs, from Slack, Adobe, Invision through AWS, Zephyr, Datadog and Sentry can be switched on to enable functionality from early stage collaboration and planning through code deployment and monitoring.
As one example of a partner integration Applause announced a bi-directional integration capability so that application owners will be able to use a Jira project management application to create a ticket that requests a specific piece of code be tested or be sent to a tester that is a member of uTest, an online community of professional testers that Applause oversees.
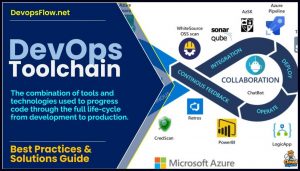
Toolchain Capabilities
In this blog they suggest a catalogue of examples, organized by the major phases in the DevOps process, describing the capabilities required for each and what tools can be used to achieve them:
| Phase | Capabilities | Tools |
| Plan |
|
|
| Build |
|
|
| Continuous integration and deployment |
|
|
| Operate / Monitor |
|
|
| Continuous feedback |
|
|