Using Tasktop and Flow Metrics to Drive an Integrated DevOps Toolchain
Nicole Bryan and Jeff Zahorchak explain the process of mapping DevOps workflow to build an integrated toolchain, and optimize it for high performance through implementing Flow Metrics.
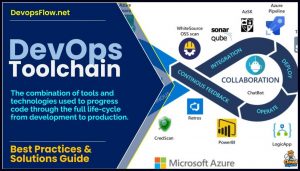 The DevOps Toolchain refers to the combination of tools and technologies used to progress code through the full life-cycle from development to production.
How effectively this interlinked chain is integrated together is key to the velocity of throughput, as manual hand-overs between steps can introduce significant delays and potential for error.
In this presentation Nicole Bryan of Tasktop and Jeff Zahorchak of Select Medical explain the process of mapping DevOps workflow to build an integrated toolchain and optimize it for high performance through implementing Flow Metrics.
Jeff explains that when they started their journey to look at Flow Metrics, they had six main problems they were trying to solve:
- i) “Swivel chair” entering of data into multiple systems. ii) Combined with multiple methods of fielding work requests from a plethora of tools such as instant messages, email etc., forcing them to context switch between many different applications.
- iii) 60% of what the team delivers were incident resolution, so iv) they weren’t working on value adding new features.
- v) Ultimately this meant they were struggling to co-ordinate work across multiple teams, and vi) this required the team to always be over-working to be IT heroes all the time.
Transformation Journey
Jeff set out to address these issues through a transformation that would:
- Get control of demand through intake management.
- Perform Value Stream Mapping.
- Simplify and integrate delivery tools.
- Implement Flow Metrics to monitor delivery.
The first step was to consolidate all the many different sources of work requests, through developing a custom portal for business users and product owners, with an ROI and approval framework, reducing the interaction methods to three main models: i) An Idea, ii) a Service Request, or iii) an Incident.
From 3m: 45s Jeff explains the heart of the challenge and how they tackled it. He describes a situation of chaos, where there are multiple process flows across multiple applications involving multiple stakeholders, with no central control system coordinating it together, no single source of truth or reporting.
To address this they develop a simplified process flow and value stream map, and transposed this on to their service delivery toolchain, which featured:
- ServiceNow for ITSM.
- Azure DevOps, for CI/CD and TFS for user stories.
- Sharepoint for storing artifacts.
- iRise for ideation and mockups.
- TestComplete for automated testing.
- SQL Server for reporting repositories, feeding Tableau and Microstrategy.
Tasktop Integration Hub
They then utilized the Tasktop Integration Hub to build bidirectional synchronization for every one of the state transitions and artifact types, eliminating the challenge of it being difficult to plan and execute across teams, as all those transition points are now automated.
For example an incident being logged through the help-desk, that would create a defect in the Azure DevOps backlog. When it is updated by a developer the help-desk team can see it in real-time.
At 6m:45s Jeff walks through the details of the benefits achieved from this approach. Remarkably it delivered value within 24 hours of going live – Over 1,200 incidents were synchronized out of the help-desk, de-duplicating 671 items from the backlog, over 4,700 hours of work. A full FTE per day was saved just by eliminating the swivel chair data entry.
Implementing Flow Metrics
Select Medical also then adopted the Tasktop Viz product, which as the name suggests caters for visibility reporting, providing the tools to implement Flow Metrics, explained from 11m:00s onwards.
Jeff begins by highlighting their primary challenge was having a lot of work items in flight at any one time, and they experienced a lot of bottlenecks.
They initially suspected this was due to a shortage of developers, but Viz provided them with the insights to realize that actually it was caused by insufficient BA resources. This data was then taken to the CIO who authorized hiring of the required resource, an unprecedented event for the company, which addressed the bottleneck and sped up the work.
Viz equips teams with the tools to identify work load bottlenecks, where you can click ‘Analyze Load’ to identify throughputs and restraints, and importantly, by connecting to all the tools used it provides a holistic view of the entire value chain.
For example Jeff showcases a key insight: Due to their adoption of these tools they were able to increase their release frequency to once a week, but this actually caused a spike in support incidents, as too many new features too quickly confused the end users. So instead they slowed this to once a month and better managed the roll outs, with more user training etc.
This highlights that simply improving the velocity of software development throughput is not a standalone goal, but rather the delivery of new products that are successfully adopted by users is instead the objective.
Seamless adoption
At 21m:40s Jeff describes how they connected Viz with their toolchain, emphasizing a key goal was to begin Flow Metric reporting with minimal impact upon their existing work.
Part of the challenge was that Azure DevOps is a very complex environment, but they were able to easily map it’s queues, backlogs and touch points as is into Viz and begin collecting metrics. It didn’t require them to do anything different in Azure or ServiceNow.
From 23m:30s Nicole explains that Tasktop can model all of the flows across the toolchain, identifying key activities and attributes like debt, features, defects and flow states, such as active, done or waiting.
This last point is key because often organizations aren’t even tracking wait-state work. Jeff validated this by highlighting that Azure DevOps doesn’t have an On Hold status for its’ user stories, which they have since remedied.
Keynote Conclusion: Accelerating Concept to Cash
A critical insight that Nicole shares is the point about the scope of the value stream mapping. Often development teams focus only on a subset of steps, notably only those that they deal with in terms of code commits, often due to what is known as a local optimization bias.
The headline goal of DevOps Flow is to view activity from a holistic business perspective, where the full process actually extends right from the very first ideation right through the end result of deployed operations.
Tasktop synchronizes workflows across all of these applications so that metrics and optimization activity is dealing with this complete end-to-end value chain.
This means performance is being managed at a level that is meaningful to business users; in short the process often described as ‘Concept to Cash’ – How long does it take the business to translate a new idea into a revenue-generating service.
Thus they can identify and invest in addressing flow bottlenecks within a context of there being a clearly understood and expected improvement that can be quantified in hard ROI terms.